



Grades 2–5
Daily Weather Log
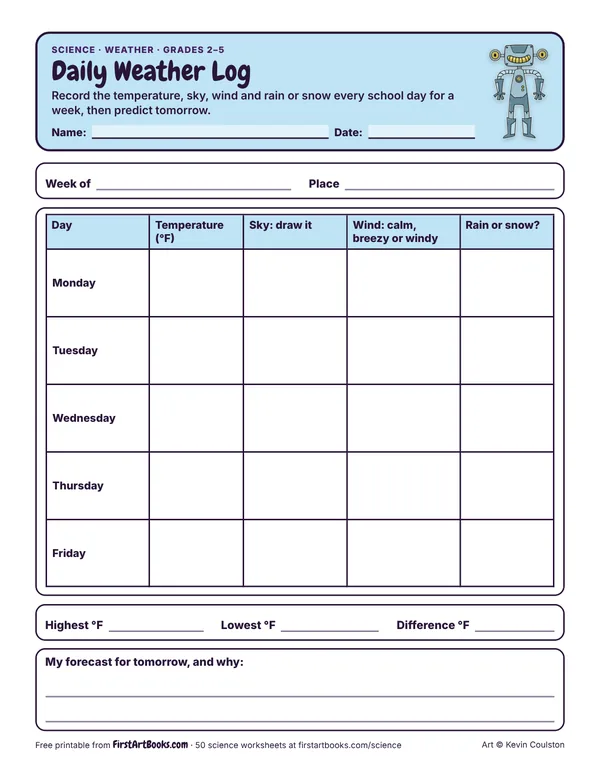
Record the temperature, sky, wind and rain or snow every school day for a week, then predict tomorrow.
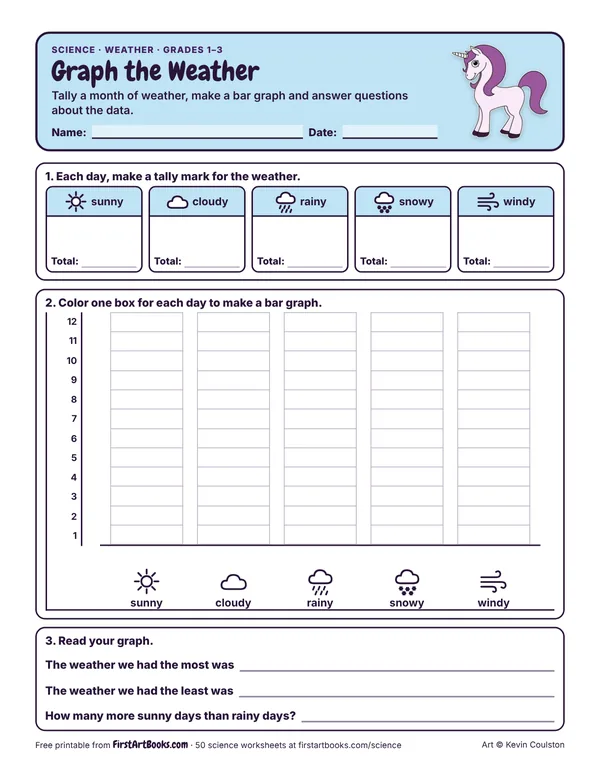
Tally a month of weather, make a bar graph and answer questions about the data.
Printed on the sheet:
sunnycloudyrainysnowywindy
Use your class weather calendar data so the graph is real.
Weather and climate are different. Weather is today; climate is the usual pattern over many years.
Compare your class weather data with the forecast on the news.
US Letter, prints well in black and white. Free for home and classroom use: print as many copies as you need.
Record the temperature, sky, wind and rain or snow every school day for a week, then predict tomorrow.
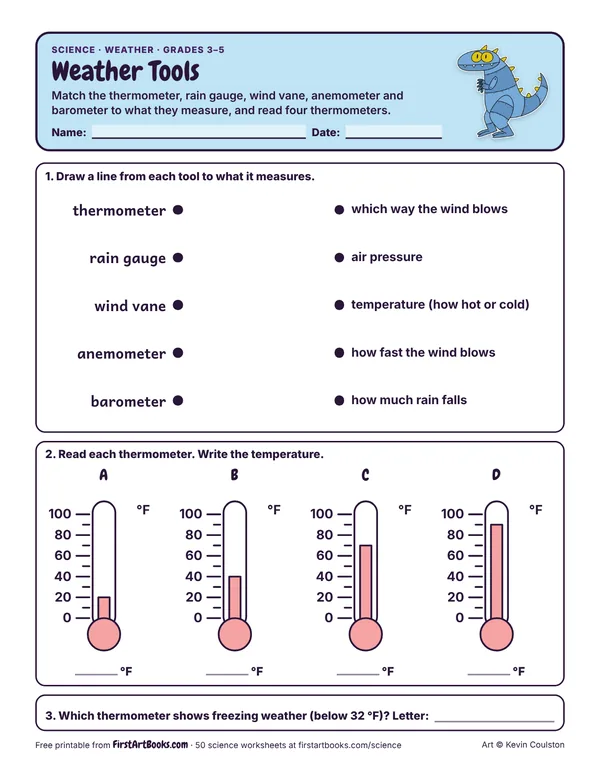
Match the thermometer, rain gauge, wind vane, anemometer and barometer to what they measure, and read four thermometers.
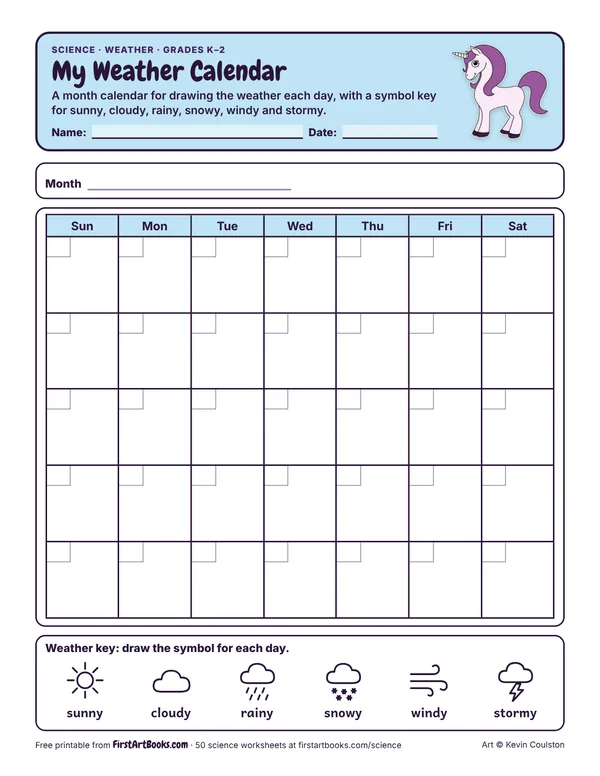
A month calendar for drawing the weather each day, with a symbol key for sunny, cloudy, rainy, snowy, windy and stormy.
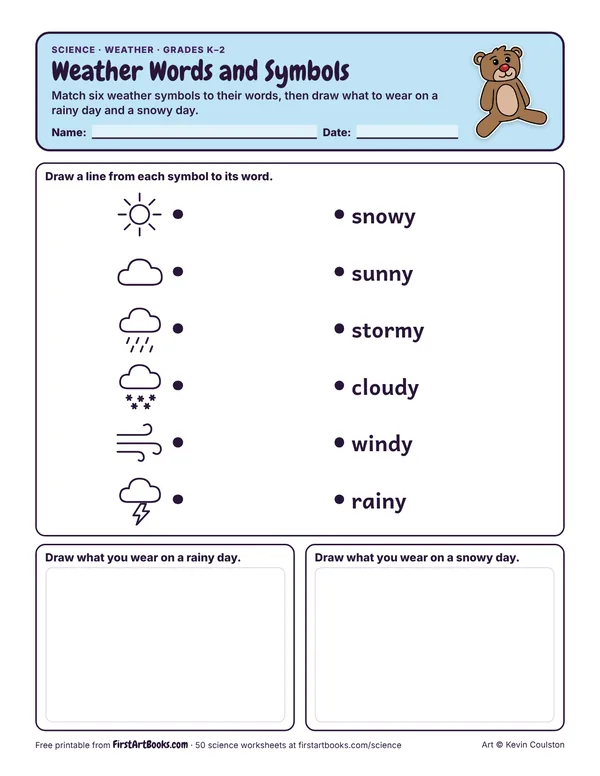
Match six weather symbols to their words, then draw what to wear on a rainy day and a snowy day.
12 printable pages: six step-by-step lessons, a grid activity, draw-and-write sheets and teacher notes, sent with your welcome email. After that, new classroom printables by email.